How many households hit a benefits cliff?

For working households that get public benefits, earning more can backfire. A pay increase can cost them more in lost benefits and higher taxes than it adds, leaving them worse off for working more. The field has no settled count of how many households hit a benefits cliff (Center for Social Development; American Enterprise Institute). The first results from a new microsimulation in The Poverty Solution's CLIFF Index give a preliminary count. The microsimulation applies 2025 program rules from the Atlanta Fed's Policy Rules Database to households in the Census Bureau's survey data and counts the households that would hit a cliff as their earnings rise. It builds on the Index's original scores, which rate how severe benefits cliffs are in every U.S. county and state.
What is a benefits cliff?
Benefits cliffs penalize households for working more and earning more, which the safety net is meant to encourage. Many working households get public benefits, such as SNAP, Medicaid and child-care subsidies, that help pay for food, health coverage or child care. As their earnings rise, those benefits shrink: some phase out gradually, and some stop all at once when income passes a limit. Taxes go up too, and so can what the household pays out of pocket for health care and child care. A household hits a benefits cliff when these losses add up to more than its pay increase, leaving it financially worse off than before.
Many households weigh the risk of losing benefits before they take on more work. In a 2023 national survey of low-wage workers, more than one in five of those enrolled in a public program had taken a step to keep their benefits, such as passing up extra hours or turning down a raise or promotion (Center for Social Development). In Utah, 43 percent of people who had received safety-net assistance since 2017 said they had limited their household income to avoid losing it. And 62 percent felt stuck in a low-income job, believing that earning more would not be worth the benefits they would lose (Sutherland Institute).
How common are benefits cliffs?
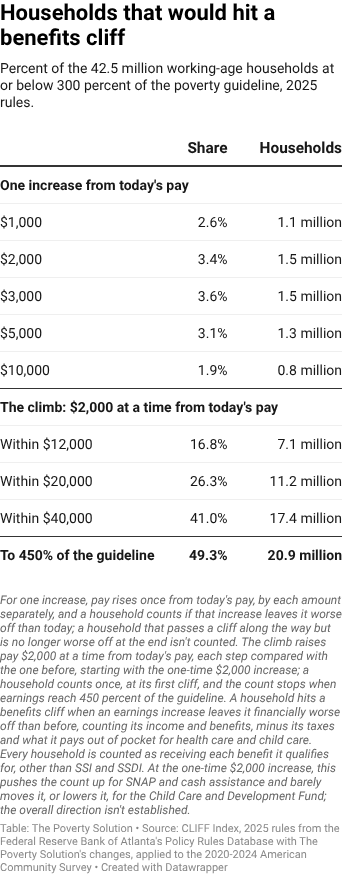
We follow each of the 42.5 million working-age households with incomes at or below 300 percent of the poverty guideline as its pay rises, until its earnings reach 450 percent of the guideline. For a family of three, that is a climb that starts at or below about $80,000 a year and ends at about $120,000. About half of these households, 20.9 million, would hit a cliff somewhere along the climb.
Some are already right next to a cliff: with $2,000 more a year in pay, about $1 an hour for someone working full time, 1.5 million households would end up worse off than they are today (see the table below for increases from $1,000 to $10,000). For the typical one, the $2,000 would cost about $3,000 in lower benefits, higher taxes and higher costs, so it would end up about $1,000 a year worse off.
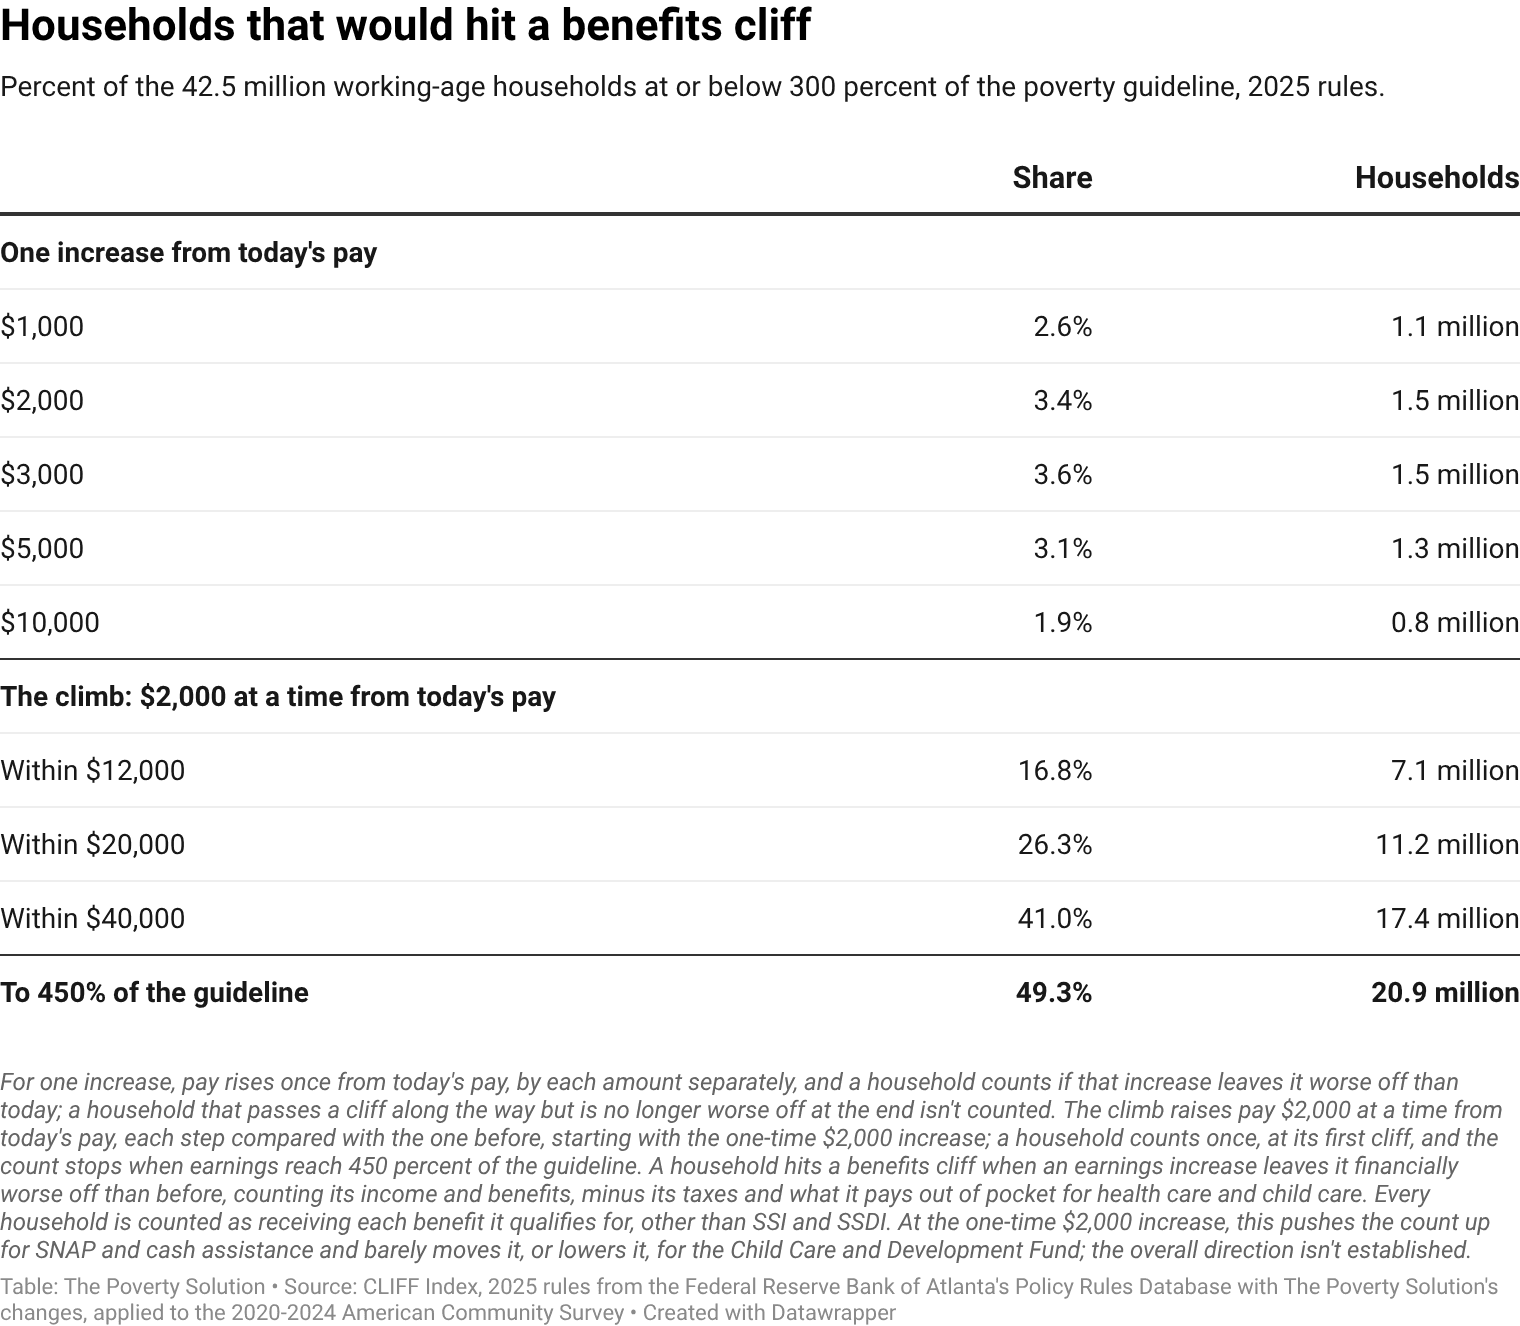
Households are discouraged from earning more, and not only by cliffs. The rules are hard to navigate. Each program has its own eligibility rules and income limits, and they differ across states and over time. A family of three can face one income line for SNAP, another for children's Medicaid and a third for child-care subsidies, each counting income differently. For a household weighing more work, sorting through these rules is likely confusing and stressful (Center for Social Development), and the confusion can leave workers afraid of hitting a cliff "even when they are not near one." Even short of a cliff, more pay is often worth less than it looks, because benefits fall and taxes and costs rise as pay goes up.
How much households lose
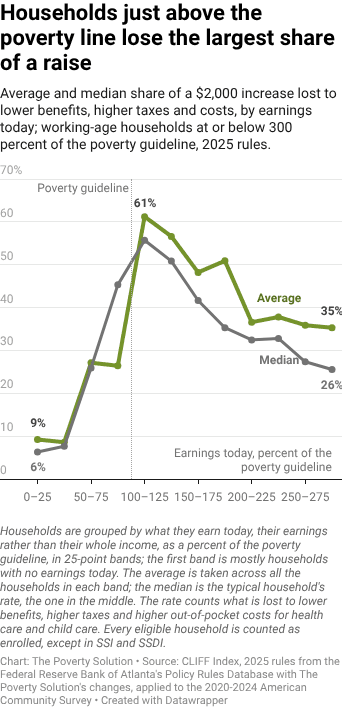
Households just climbing out of poverty keep the least of a pay increase. Part of each added dollar goes to lower benefits, higher taxes and higher out-of-pocket costs for child care and health care; that share is called the effective marginal tax rate. Just above the poverty line, the typical household would lose about 56 cents of each dollar of its next $2,000 in pay. On average, the rate stays high until earnings pass twice the guideline (see the chart below). A 2019 brief from the Department of Health and Human Services also found rates highest just above the poverty line for households with children.
On average, SNAP and the EITC make up most of what these households lose, since just above the poverty line both phase out as earnings rise. For a single parent with two children, the two together take nearly half of each added dollar: 24 cents under SNAP's basic rule and 21 cents for the EITC.
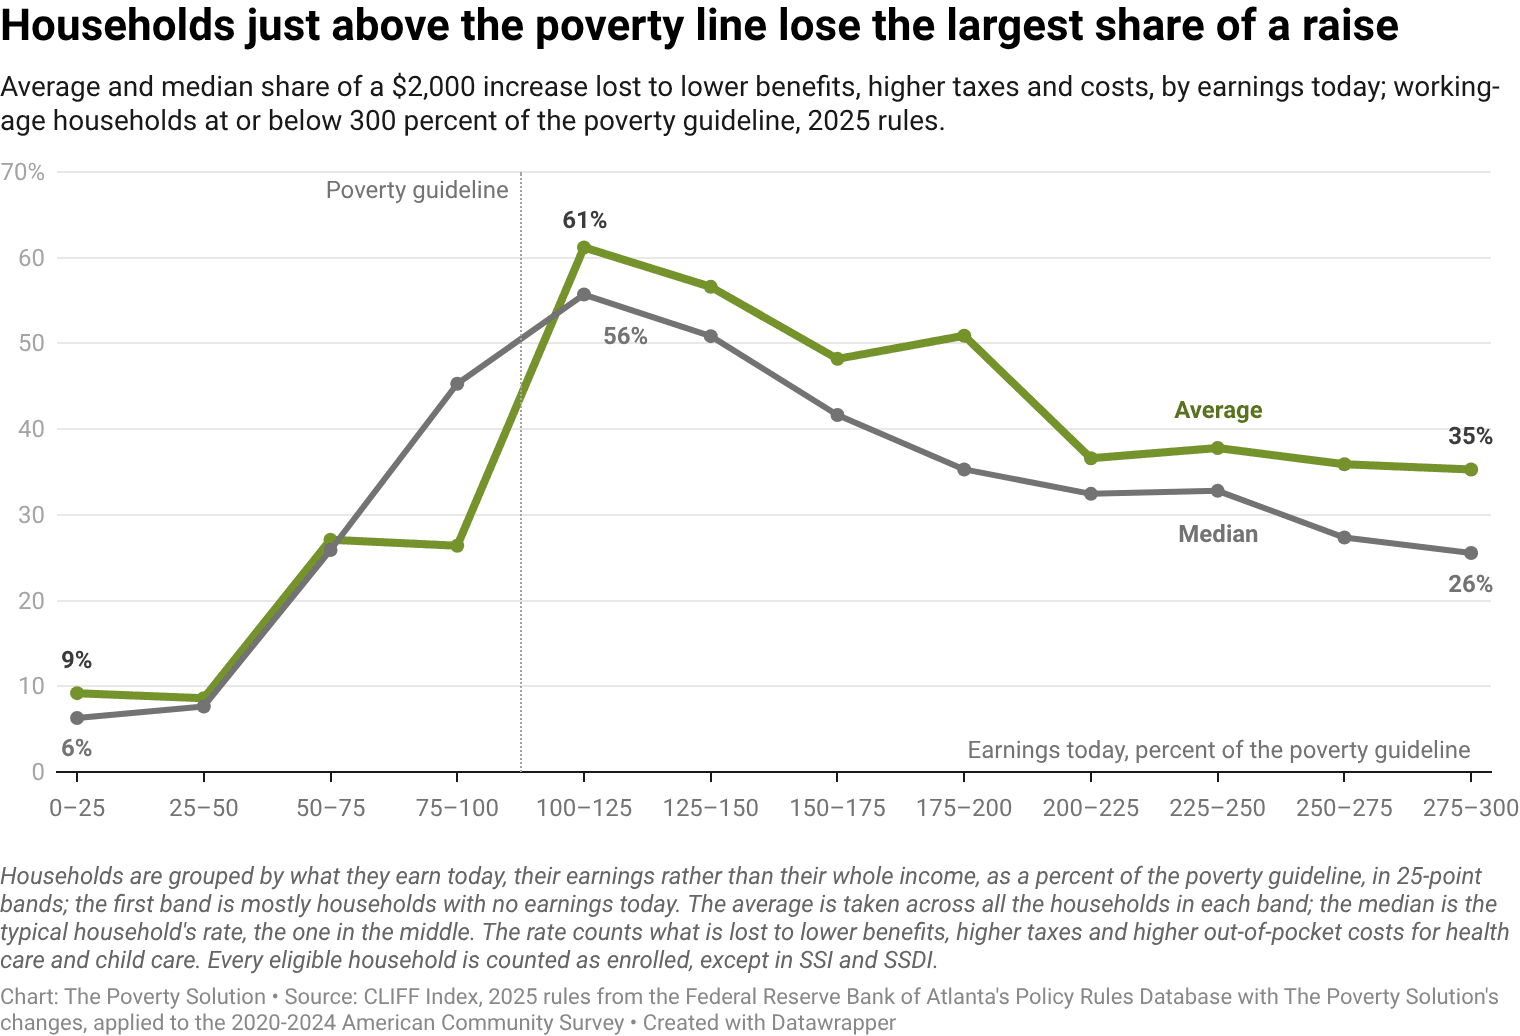
A household can keep half or less of a pay increase and still come out ahead. Counting costs of work such as child care, about 1 in 5 households would keep 50 cents or less of each dollar of a $2,000 increase.
A pay increase also plays out on two clocks. Pay rises with the next paycheck and benefits fall as each program catches up with the new income, but tax credits like the EITC settle once a year, at tax time. At the lowest earnings, where the EITC still grows with pay, a household can have less each month for rent and groceries than before the increase, until its refund arrives. In Urban Institute interviews in three states, parents receiving or recently off cash assistance tended to feel the benefit cuts more sharply than the rise in their tax credits, which typically came only after they filed. Just above the poverty line, where the EITC phases out, the timing runs the other way: part of the loss comes later, as a smaller refund.
Whether high rates change how much families work is less settled. Some families report passing up extra hours or a raise to keep their benefits, but the Institute for Research on Poverty calls the research mixed on whether marginal tax rates substantially change behavior. It notes that families often find the rates hard to anticipate, and that some researchers see any drop in hours as tempered, since most people can't easily choose how many hours they work. Either way, it adds, the rates set how much more families have when they work more, which it calls "a potentially important issue of fairness."
Which programs drive cliffs
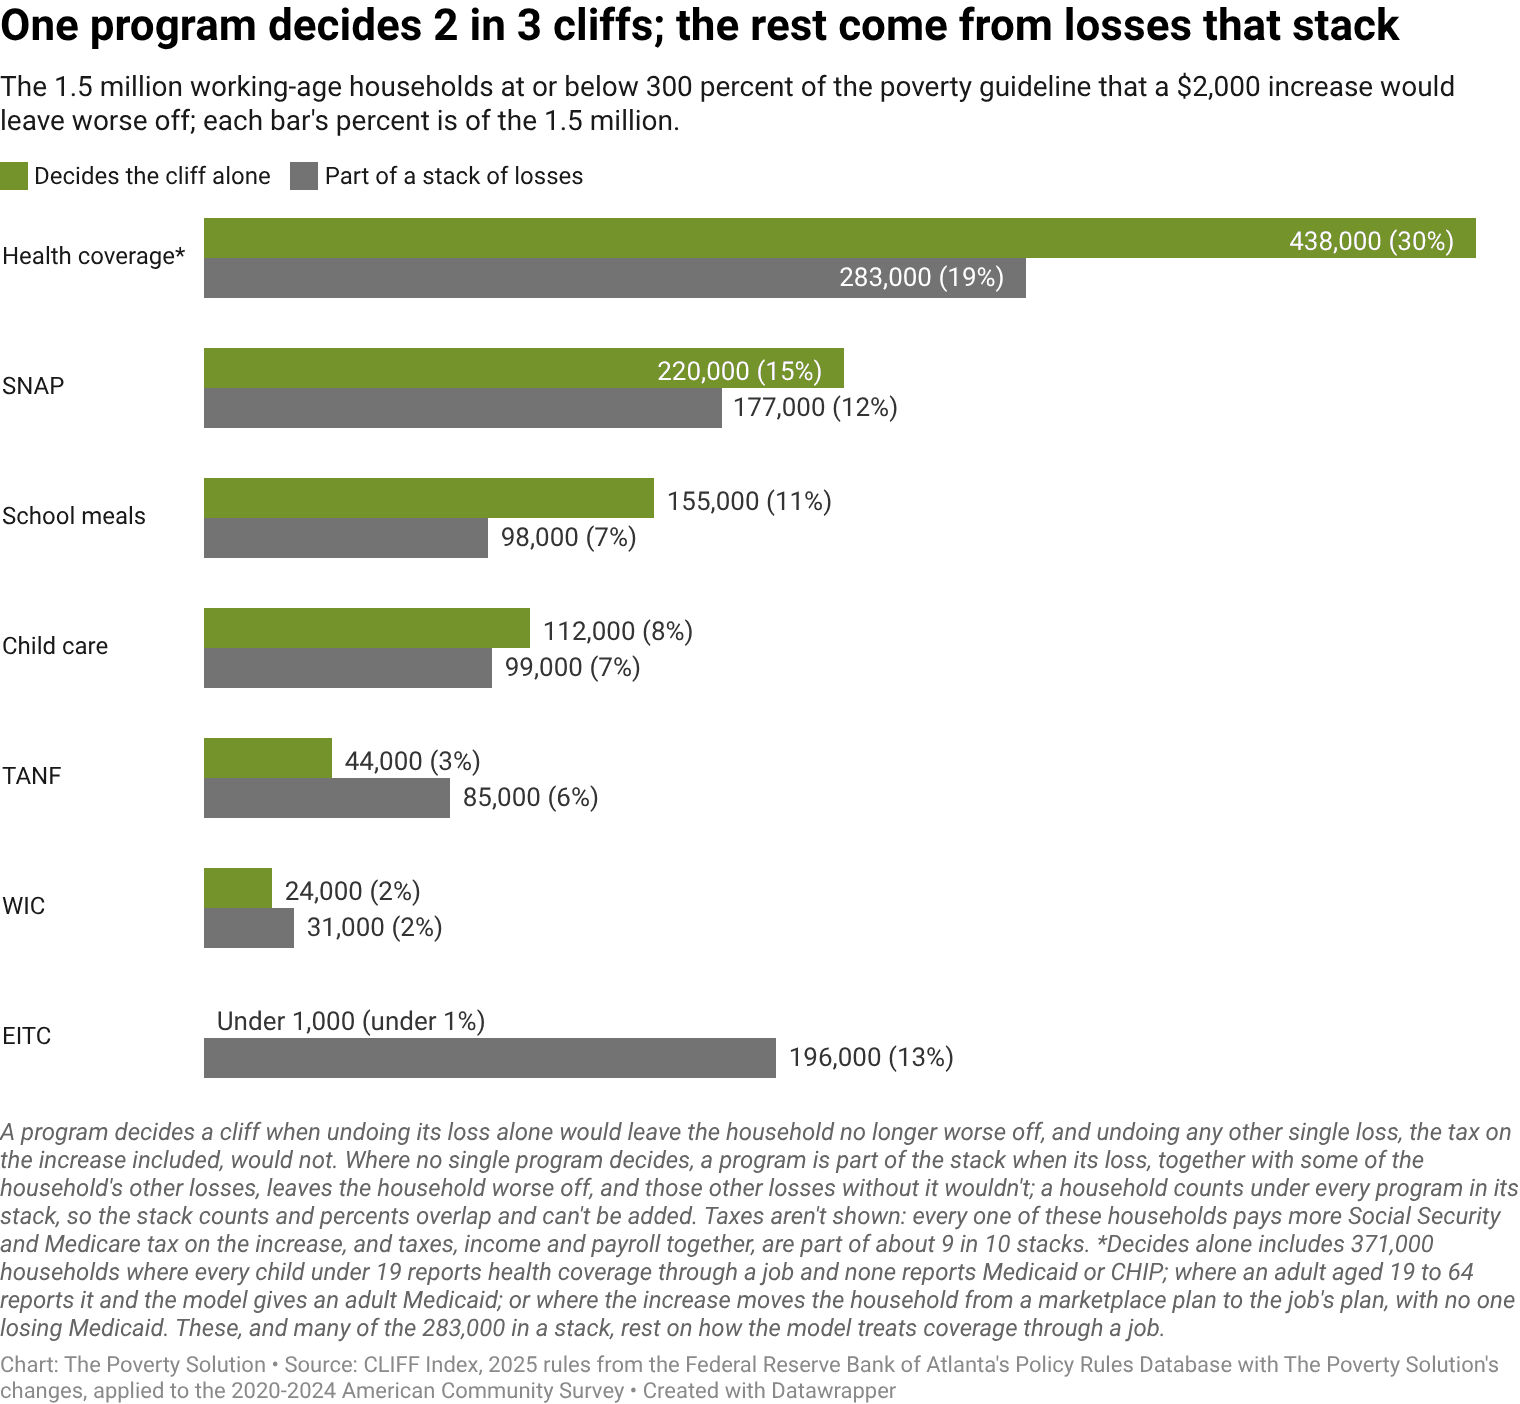
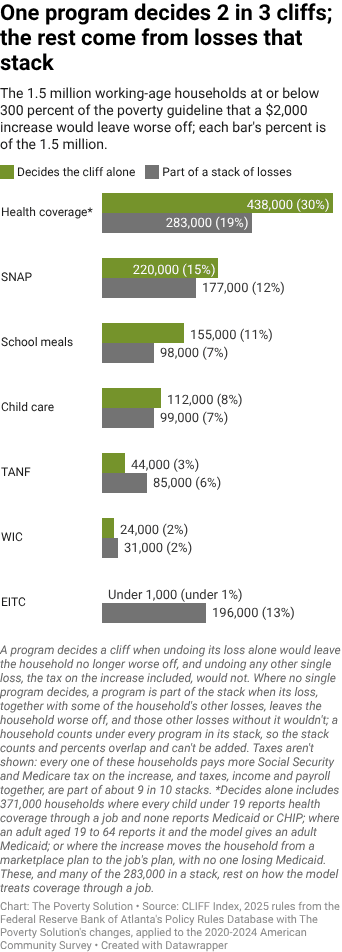
For the 1.5 million households right next to a cliff, what pushes them over is most often the loss of health coverage or SNAP (see the chart below). SNAP's income line in federal law, 130 percent of the poverty guideline, sits just above the poverty line, near where the marginal tax rate peaks. At a larger increase of $10,000 a year, about $5 an hour for someone working full time, child care drives more cliffs by itself than any other program.
Most of the health-coverage cliffs rest on one assumption in the model. Where someone reports coverage through a job, the model may put members of the household on Medicaid, the Children's Health Insurance Program (CHIP) or a marketplace plan with a premium credit instead, and a pay increase can end that coverage. Without those cliffs, SNAP leads at the $2,000 increase (Methodology).
For about 2 in 3 of the households right next to a cliff, a single program's loss decides it (Methodology). For the other third, no single loss does, and the cliff is a stack of two or more losses that land together. The tax on the increase and the EITC's phase-out, which both come gradually, almost never make a cliff by themselves but often add to one. The tax is part of about 9 in 10 of these stacks, and the EITC is part of about 200,000 of them.
Households with a child under 18 are 3.4 times as likely as households without one to be right next to a cliff. The Department of Health and Human Services found a similar gap on 2014 data: among households below twice the poverty line, those with children were more than three times as likely to face a cliff after a $2,000 increase. Several of the programs behind these cliffs serve children or families with children: school meals, child care, WIC food benefits, children's health coverage and cash assistance.
Where states draw the lines
A household in Missouri is nearly five times as likely as one in New Mexico to be right next to a cliff, 5.9 percent against 1.2 percent, and the other states and the District of Columbia fall between them. Part of the gap is who lives in each state. Part is what child care and health coverage cost there, since a household that loses help with them starts paying more of the bill itself. And part is the rules each state sets.
Most of the programs behind these cliffs are set in federal law, but states draw several of the income lines. Within federal limits, each state sets the lines for children's Medicaid and CHIP and for child-care subsidies. It also decides whether adults can get Medicaid up to 138 percent of the poverty guideline, and whether to raise SNAP's income line above the federal 130 percent, as high as 200 percent (see each state's SNAP line and Medicaid expansion in the table below).
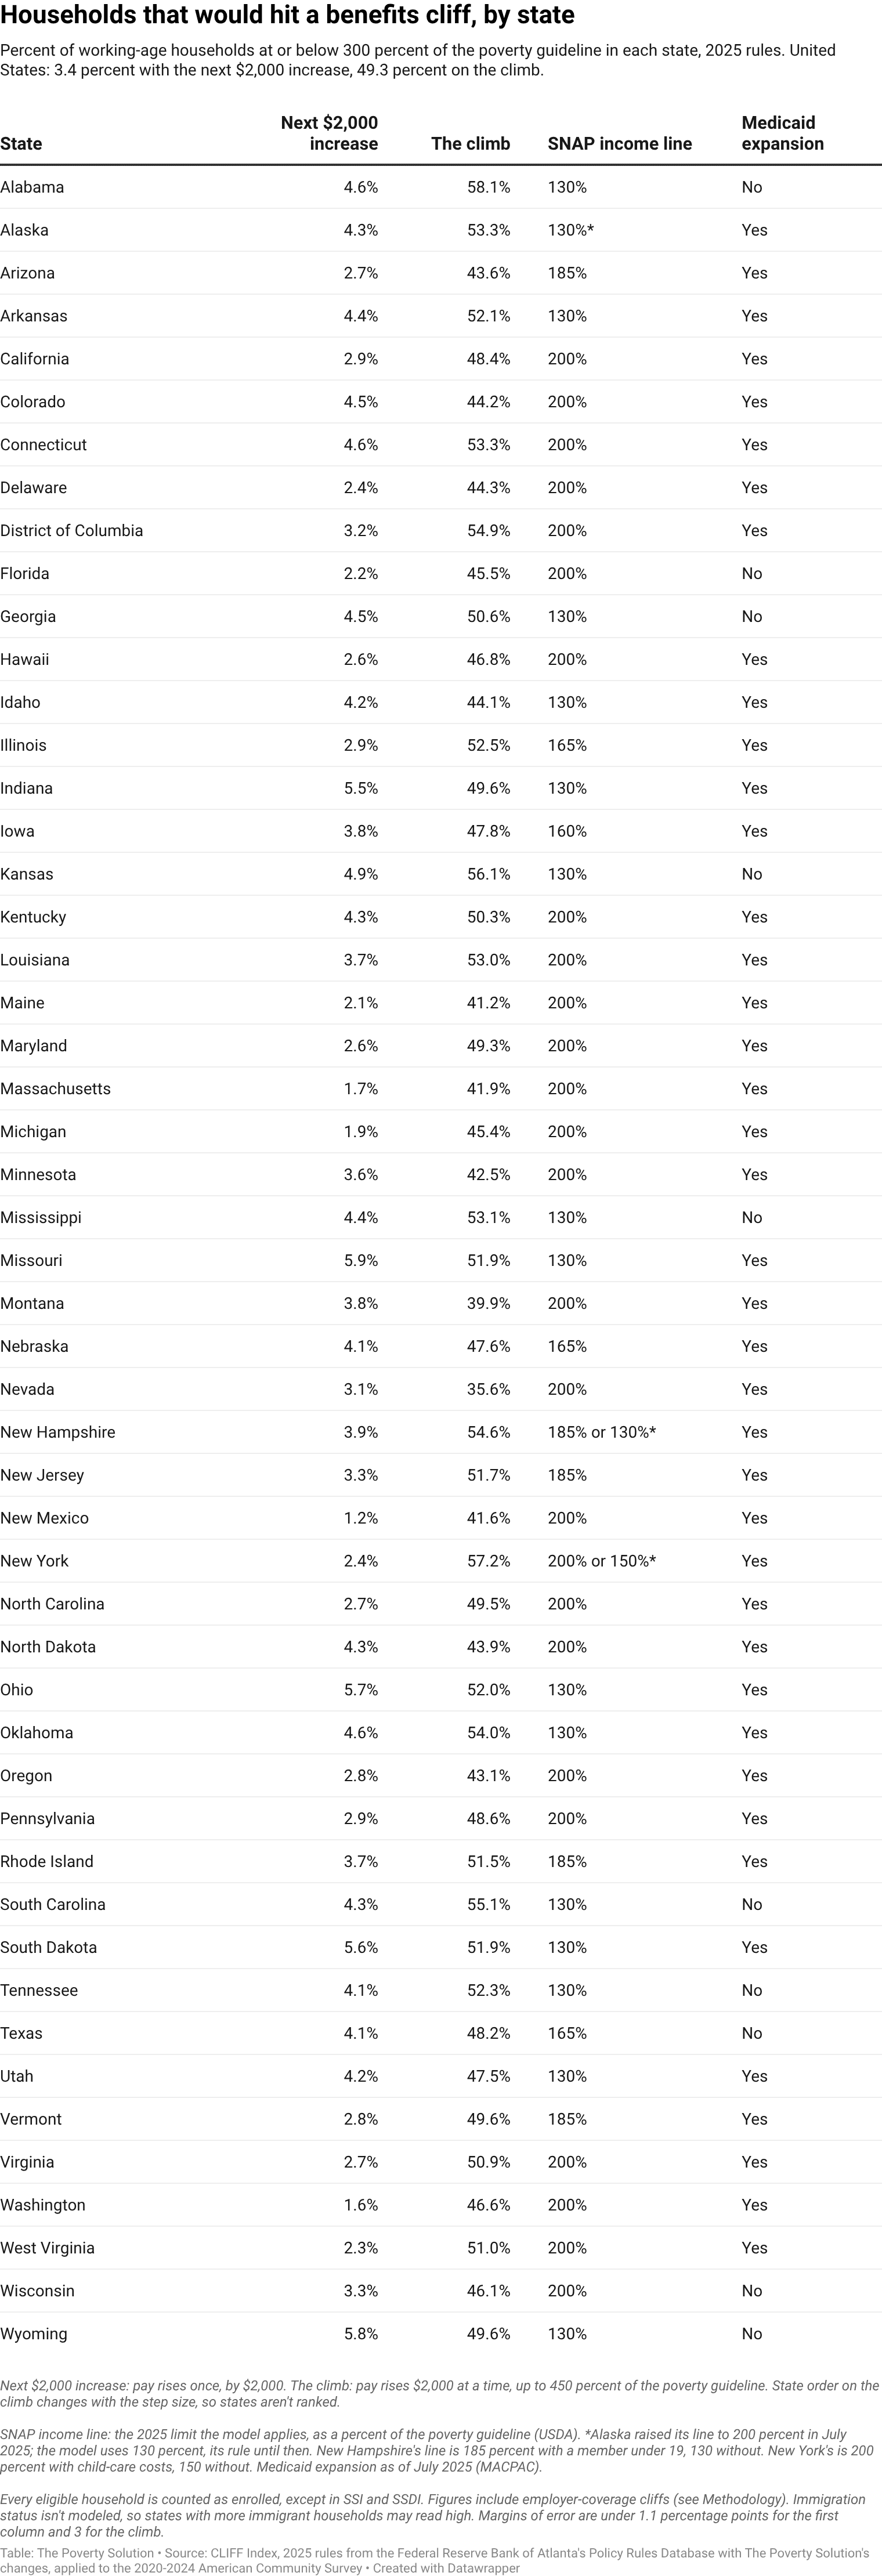

As income rises, SNAP's benefit shrinks at a phase-out rate that federal law sets the same for every state. But the benefit ends at an income line, 130 percent of the guideline for most households unless the state raises it. A household still receiving a benefit when its income crosses that line loses what is left all at once.
The Georgetown Center on Poverty and Inequality points to the option that lets a state raise the line, which it says "reduces the risk that a family's increased earnings trigger a sudden loss of food assistance." The American Enterprise Institute would reset the phase-out rate so that benefits fall to near zero before income reaches SNAP's limits, cut income deductions, and ask states to review the lines they have raised. It also says that where states have raised the line, households "can still face a benefit cliff when the benefit amount remains relatively high at the program exit point."
Among the states that expanded Medicaid, a higher SNAP line goes with fewer cliffs, though not none. Among them, households in the states where the model's 2025 rules put the line at 200 percent are less often right next to a cliff than those in the states at 130 percent: 2.9 percent against 5.1 percent. Before their earnings reach 450 percent of the guideline, they are also less likely to hit a cliff where SNAP's benefit stops: 10.5 percent against 21.5 percent. In the states at 200 percent, 3.5 percent would still reach that line on the way up and lose the benefit there. Households are reweighted to the same mix of income, family size and children, and the states still differ in other ways (Methodology).
On cliffs from any program, the states at 200 percent and those at 130 are closer together: close to half of households in both would hit one before their earnings reach 450 percent of the guideline. SNAP's phase-out rate is the same in every state, so no state shows what a different rate would do. Testing the option Georgetown points to, or the American Enterprise Institute's proposal, means running the same households under today's rules and under the change.
The field's proposals
Several proposals across the field would change programs together. Beyond the Cliff asks that no family lose more of a pay increase to lower benefits and higher taxes combined than the top income tax rate would take, and names earned income disregards as one solution. It also asks for a "super waiver" authority for demonstrations across benefits programs, and the American Enterprise Institute calls on Congress to standardize eligibility rules and benefit phase-outs across programs. In the state RISE pilots the American Idea Foundation proposes, seven benefits would combine into a single benefit that could decline consistently as earnings rise.
Two of the field's proposals call for reviews that could start from these counts, one federal and one by each state. Beyond the Cliff would have a federal interagency body review where barriers to economic mobility sit within and across programs, and the American Enterprise Institute asks each state to assess its own cliffs and whether its administrative choices affect how severe they are.
We'd like to run proposed fixes through the same households, working with the coalitions, researchers and states behind them. A run could count the cliffs a fix removes, both those a single program decides and those where losses stack. It could also show how much of each added dollar households would keep, and where any cliffs the fix creates or moves would fall. To take part in a run or use the data behind these counts, write to info@thepovertysolution.com.
Sources
- Beyond the Cliff. Beyond the Cliff: The Challenge of Benefits Cliffs and How to Fix Them. October 2025. A coalition of more than 50 organizations, convened by the Martha O'Bryan Center.
- Roll, Stephen, Selina Miller and Mathieu Despard. "The Impact of Benefits Cliffs and Asset Limits on Low-Wage Workers: New Evidence from a Nationally Representative Survey." CSD Research Brief No. 25-07. Center for Social Development, Washington University in St. Louis, May 2025. https://doi.org/10.7936/5ykn-5z34.
- Dunn, Nic. Strengthening the American Dream: Addressing Benefits Cliffs to Empower Safety Net Participants to Pursue Work and Opportunity. Sutherland Institute, November 2024.
- Bandoch, Joshua, Nic Dunn, Leslie Ford, Angela Rachidi, Erik Randolph and Matt Weidinger. Stranded by the Safety Net: How to Fix the Benefit Cliff Problem. American Enterprise Institute, December 2025.
- Federal Reserve Bank of Atlanta. Policy Rules Database, commit a402dc07 (August 18, 2026). https://github.com/Research-Division/policy-rules-database/tree/a402dc076a8064d3b72ae8d2793992f46c5c9cc3. A collaboration with the National Center for Children in Poverty; originally developed by Elias Ilin and Ellyn Terry. Policy Rules Database Technical Manual, updated July 7, 2024.
- Ford, Les. Reforming the Safety Net through RISE Pilot Programs. Policy white paper. American Idea Foundation, 2026.
- Scott, Stephanie. Making Work Pay: Ending Benefits Cliffs for Families. Brief. Georgetown Center on Poverty and Inequality, 2026.
- Chien, Nina, and Suzanne Macartney. "What Happens When People Increase Their Earnings? Effective Marginal Tax Rates for Low-Income Households." Brief #2 in the ASPE Marginal Tax Rate Series. Office of the Assistant Secretary for Planning and Evaluation, U.S. Department of Health and Human Services, March 2019.
- Anderson, Theresa, Amelia Coffey, Hannah Daly, Heather Hahn, Elaine Maag and Kevin Werner. Balancing at the Edge of the Cliff: Experiences and Calculations of Benefit Cliffs, Plateaus, and Trade-Offs. Urban Institute, January 2022. Interviews and focus groups with 43 people who were receiving TANF or had recently received it in Colorado, Minnesota and New York, October 2020 to April 2021.
- Institute for Research on Poverty. "Understanding Benefit Cliffs and Marginal Tax Rates." Fast Focus No. 43-2019, September 2019.
- Medicaid and CHIP Payment and Access Commission. "Exhibit 36. Medicaid Income Eligibility Levels as a Percentage of the Federal Poverty Level for Non-Aged, Non-Disabled, Non-Pregnant Adults by State, July 2025." MACStats: Medicaid and CHIP Data Book, February 2026.
- Medicaid and CHIP Payment and Access Commission. "Exhibit 35. Medicaid and CHIP Income Eligibility Levels as a Percentage of the Federal Poverty Level for Children and Pregnant Women by State, July 2025." MACStats: Medicaid and CHIP Data Book, February 2026.
- U.S. Department of Health and Human Services, Administration for Children and Families, Office of Child Care. CCDF Family Income Eligibility Levels by State. January 2025.
- U.S. Department of Agriculture, Food and Nutrition Administration. "Broad-Based Categorical Eligibility (BBCE)." Chart, updated June 2026. https://www.fna.usda.gov/sites/default/files/resource-files/BBCE-States-Chart-June2026.pdf
- U.S. Census Bureau. American Community Survey, 2020-2024 five-year Public Use Microdata Sample.